The winter of 2009-2010 was very rough here in Morgantown, WV as it was in much of the mid-Atlantic and Northeast. At one point in early February (4-11 to be exact) it was so bad school was closed. The following is a review of the usage of the WVU Mobile Web during that time period. Overall there was a fourfold increase in traffic to the system. While we had to manually update the emergency information we made sure it was as up-to-date as any of the other outlets on campus. I think this shows that there is a need for an institution to deploy mobile products to help communicate information during a crisis.
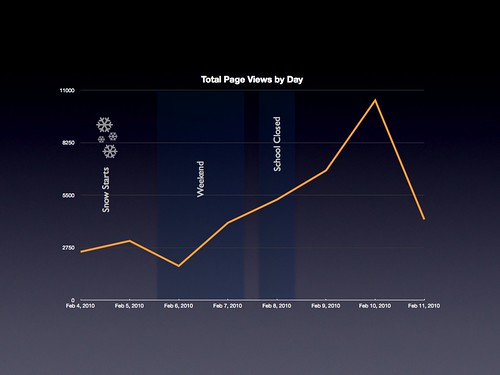
Prior to the snowstorm WVU Mobile Web would usually average around 2,700 page views on a weekday. Starting February 7 WVU Mobile Web set records for total page views every day until February 10 when it reached a peak of 10,400 page views. It seems that the more uncertainty their was regarding if school would be open the greater the page views. WVU Mobile Web really became an important outlet in letting users know what was going on at the school. The last data point, February 11, is still well above the average at 4,100 page views.
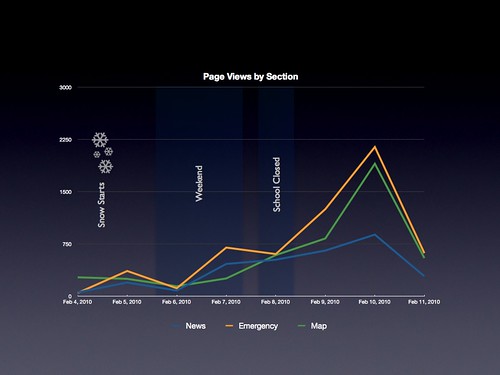
The record page views were partially driven by visits to two sections that normally don't see much traffic, Emergency and News. Both sections, prior to the snowstorm, averaged 150 page views total per week. On February 10, the peak for visits, Emergency had 2,100+ page views and had had 5,200+ page views over the previous week. That's 34 times the normal average for a week. News was similar if slightly lower. On the day of the peak it had 880+ page views and had 2,800+ page views over the previous week. Emergency was updated as weather alerts went out with the latest information regarding the status of school. News was updated with the regular RSS feed from WVUToday. Other sections continued along their normal average. The only other section to see a significant increase was Map. I'm still unsure why Map saw an increase.
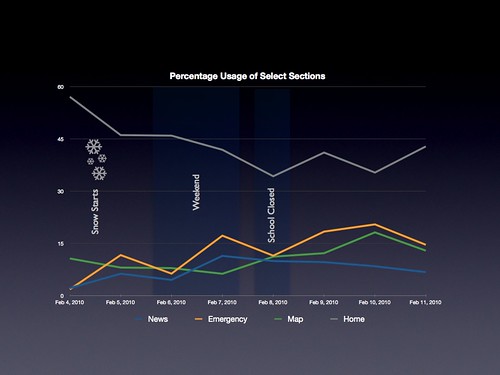
In order to gauge real use of WVU Mobile Web we need to look at how activity in each section, including the home page, relates the the total page views of the system. Our WiFi login home page is the WVU home page so when a user signs into the WiFi network from their iPod Touch they visit WVU Mobile Web automatically. They may leave the service immediately but they'll count as a page view. If a user visits a section then they've had two visits, home and the section. So we know the system is really being used if the percentage of home page visits is 50% or less of the overall traffic. As you can see the percentage of home page visits was less than 50% for the entire event showing that the system wasn't just acting as a landing page for WiFi logins.
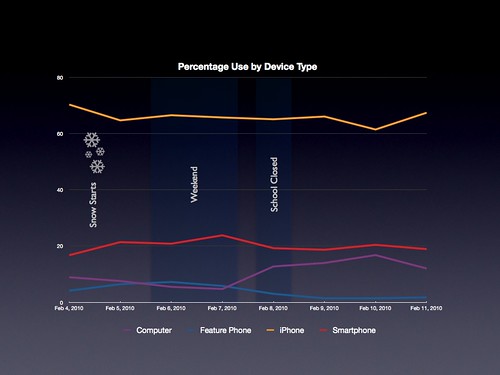
Finally, here's a breakdown of use of WVU Mobile Web by device type as the snowstorm continued. The most interesting line is the purple one. While iPhone and Smartphone stay roughly the same over time their was a doubling, percentage-wise, of use by computers. It's interesting that while we target WVU Mobile Web to mobile devices it is accessible, and was obviously used, by users at their desks. This may show that their is an untapped audience out there who may find the services Mobi provides useful. Feature Phone has the bump just because the total page views for the 6th are low so any visit by a Feature Phone is magnified in the percentages.