With the close of the spring semester it's time to start looking at numbers from our various products to see where we can improve. One product that I was really interested to review this year was our presence on foursquare. We joined the "foursquare for Universities" program in late October last year and at that time I wrote up a blog post about how I thought foursquare could be used by universities. We've also featured foursquare on our Connect to WVU website as well as our social media footer.
So far we've just been experimenting with foursquare. When we started with it our primary goal was simply to make sure the data was correct. As we move towards the upcoming fall semester I expect us to use it more with projects. There are definitely a lot of interesting possibilities with this service.
If you're interested in learning more about foursquare be sure to check out *a good list of foursquare-related resources that *Tiffany Broadbent (@tb623) recently put together. John Lucas (@jplucas55) also posted a nice article about @UWMadison‘s experience with foursquare in LINK.
The Source of the Data
Because I have my own tool for tracking foursquare usage I wanted to be clear that the data for these charts comes from foursquare's own statistics download available in the "Manager's Tools"-section of our foursquare account page. For us, data started being recorded on Dec. 6, 2010 even though we had been a part of the program for at least a month by that date. Also, in comparison to the numbers I've run I believe some data was purged at some point. If you decide to replicate what I've done you'll be in for a bit of a copy & paste slog. Other than the demographic data the venue data isn't listed in any really useful way for comparison.
Demographics
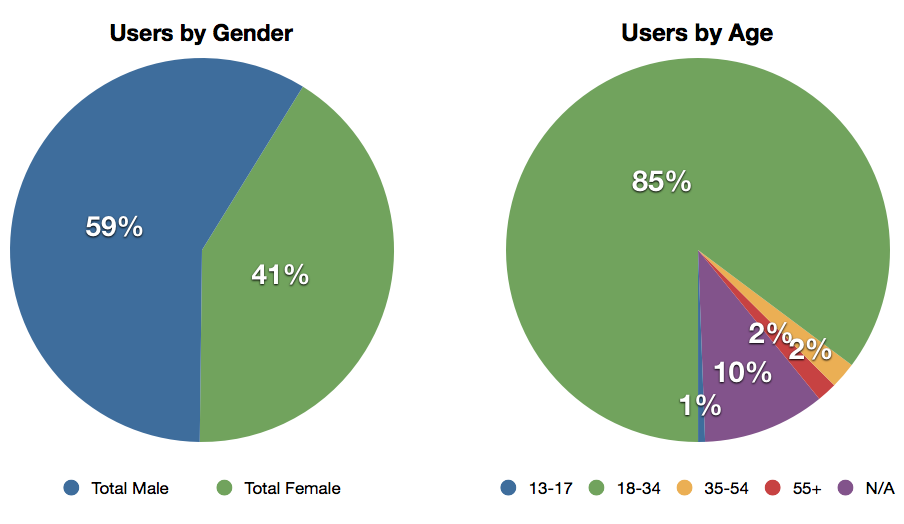
I don't think these numbers offer anything really surprising. There's a rough 50/50 split based on gender for those users who have checked in at one of our venues. Considering the population of our campus the 18-34 age group absolutely dominates. I wish we were able to look at more granular age ranges here to narrow down the population more (e.g. freshman pick-up of the service vs. senior pick-up of the service).

Tracking the Check-ins
Between Dec. 6, 2010 and May 24, 2011 the total number of foursquare check-ins grew by 250%. There had been 13,216 check-ins all-time at our official venues by Dec. 6 and we finished out at 33,425 check-ins. Using my unofficial numbers we had added ~3,000 check-ins in the month of November alone. So, on the face of it, a decent rate of growth.

I think when you look at the rate of check-ins though it's a little more underwhelming of a number. Our max check-in day was April 4, 2011 with 359 check-ins. I have no idea why that day is so popular. The average for the time period is ~150 check-ins per day. The good news is that after spring break we were averaging 190 check-ins a day so there's definitely a sign of improvement. You can also see that improvement in this chart of check-in rate by day.

On a campus this size though… again, it seems underwhelming. Though I do have to wonder how much dark check-ins have an effect on check-ins at our official venues. Basically, are users more likely to check into an office "venue" that they've created as opposed to the building where their office is located?
Finally I tried to organize venues by a very loose type. Essentially I wanted to see if there were specific types of locations that monopolized check-ins at the school. Our student union, the Mountainlair, definitely holds a very large percentage of total check-ins.

By far the most underwhelming type of venue is the dining. I honestly thought that would perform much better. Maybe that's the kind of venue that would benefit from special deals.
Miscellaneous Data: Photos, Tips, & Badges
While uses of special deals are available in the dump of data from foursquare surprisingly photos & tips are not. To me they're some of the more interesting ways our users interact with our venues sans special deals.
From my unofficial source there have been 178 tips left on our venues. I wish I had totals on how many have actually been completed. It's something I'll have to look at the API for to see if I can tease that kind of information out of it. One of the more interesting things we've done with tips is leave them at alumni gathering spots.
One fairly recent addition to foursquare was support for users to add their own photos to venues. So far we've had a total of 27 photos added to our venues. This feature is one of the more exciting ones to me. Between the foursquare app and the API I think this could be a really useful way for schools to collect imagery and build integrated web & location-based social experiences. Of the 27 photos 8 were added at basketball games.
Badges… one of the selling points for foursquare and, specifically, the university program is the ability for users to collect special badges. As someone wanting to evaluate use I'd love to know how many users collected school-specific badges and which ones. It might help us figure out use patterns. At the moment it doesn't appear that their is any way to see this data.
Conclusion
So the final word on this? Really not too bad. Definitely areas for improvement but, most importantly, with the API and a focus on some of our more popular venues their may be some cool possibilities. We definitely achieved our goal this first year of making sure the data was correct. This next year is where we see if we can really leverage the service.