Now that we are a little over a year into having a central mobile website for West Virginia University I decided it'd be a good time to share some numbers. Hopefully the charts showing the performance over the last year prove informative as you look to implement mobile solutions on your campus.
As a quick refresher… we launched our mobile site, WVU Mobile Web, in late August 2009. We originally used the MIT Mobile Web framework and it took a few weeks to get the framework customized for WVU. We have since documented and re-released a generic version of the framework as Mobile Web OSP which included a second version in May 2010. Our mobile site acts as a portal into various non-academic services like our directory, campus map, and events calendar. It is definitely a product focused on current students as well as on-campus faculty and stuff. At the same time we launched our mobile site we also launched a student-developed iPhone app called iWVU. And just so you can judge scale and possibly performance for your campus WVU has about 32,000 students.
Overall Numbers
So some interesting, high-level points from the last year:
- 832,615 total page views (again for scale, our home page did a hair over 10 million page views during that period)
- 70% of users tracked by Google Analytics returned more than once
- Users averaged 2.5 pages per visit
- Users visited from 134 countries and all 50 states
WVU Mobile Web Traffic by Semester
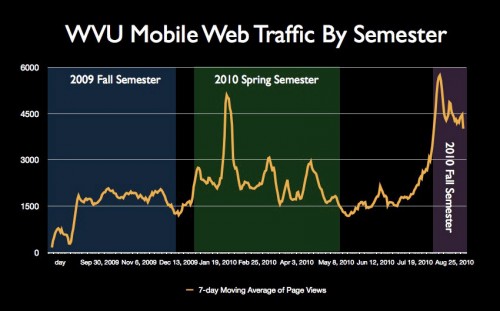
The following is a general trend of traffic broken out by semester:
- 2009 Fall Semester – 1,536 avg. page views per day with a max. of 2,565
- 2010 Spring Semester – 2,385 avg. page views per day with a max. of 10,463
- 2010 Fall Semester (so far!) – 4,690 avg. page views with a max. of 7,796
Between 2010 Spring and 2010 Fall we saw a 100% increase in usage. Between 2009 Fall and 2010 Fall we've seen a 200%+ increase in usage. There's a very clear trend that mobile devices and the mobile web are being used more and more on campus. Honestly I find the year-to-year increase pretty staggering for something that isn't getting a lot of advertising. Especially when you consider we've done nothing for the start of this school year and we've had the most use so far.

Some Points of Interest
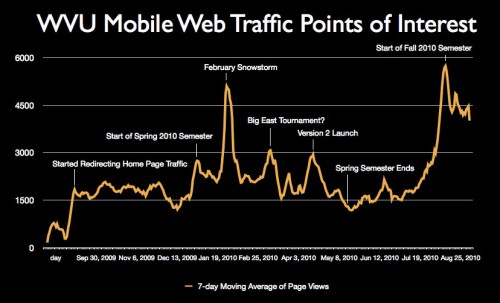
There are some pretty obvious spikes in the data above. The following chart attempts to explain the obvious highlights (click on it for a larger version):

There are obviously two really big points of interest. The first is the big spike we have about halfway through the year in February 2010. The February 2010 snowstorm generated 10,000+ page views in one day so the spike is actually even more dramatic than this particular chart shows [more in-depth mobile usage details]. The second point of interest is the obvious increase in usage to start the Fall 2010 semester. My fingers are crossed that this trend continues for the rest of the semester. I think this is due to their being more Android devices on campus but I'm not positive. At the moment I feel like we're reacting a bit to what's happening and sort of guessing at reasons.
Traffic by Select Sections
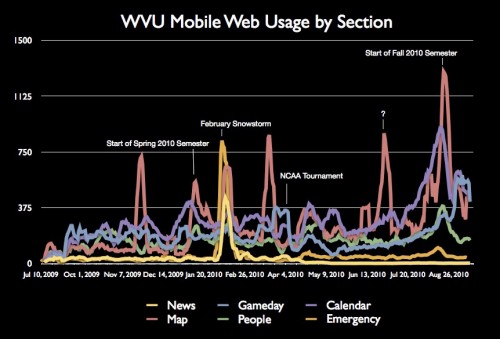
The following are the top six sections for WVU Mobile Web. The most consistent performer for us so far has been the calendar section. I think that's partially due to interesting content as well as the number of screens a user has to dig through to get to that content. Mobile web usage is all about context and I think the top sections really reflect this. Campus map spikes out at very specific times (there are three spikes I don't really understand though). The news section flatlines because, after the launch of version 2, we redirected all mobile requests for news directly to the mobile version of WVUToday.
Just so you know these are the percentages of traffic by these top six sections:
- 14% – Calendar
- 13% – Campus Map
- 9% – Gameday
- 7% – People
- 3% – Emergency
- 1% – News

Traffic By Device Family
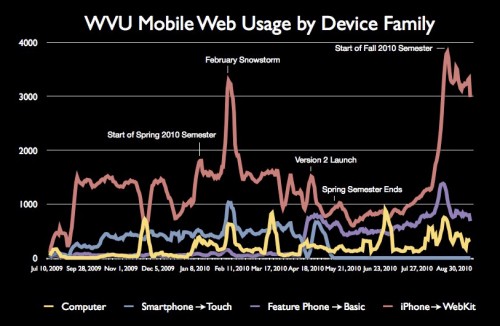
WVU Mobile Web uses device detection to display the appropriate templates per device. This chart is not the most accurate because in April 2010 we actually switched up how we categorized devices. For example, before April 2010 Android was shoved into the "Smartphone" category. After April 2010 it's in the "WebKit" category. We actually stopped serving the "Smartphone" templates in April 2010 hence why that grouping flat lines (there was a sort transition period to address a bug though). iPhone/WebKit obviously trounced the other device families with a huge separation to start Fall 2010.

Conclusion
Simply put, mobile web is a viable platform for delivering campus content. Note that this is at a school that also has an iPhone app so it's not like mobile web is the only game in town here. The rate of increase in mobile web usage semester-to-semester (200%+) is pretty incredible to me. With a lot of that powered by Android (roughly 30% of the page views this semester) it shows that other platforms are starting to compete effectively with the iPhone and that mobile web is a good solution for delivering to as many devices as possible. Mobile is here… the only question is when are you going to get onboard and deliver you own solution?